Projects
Data projects, interactive tools, and experiments.
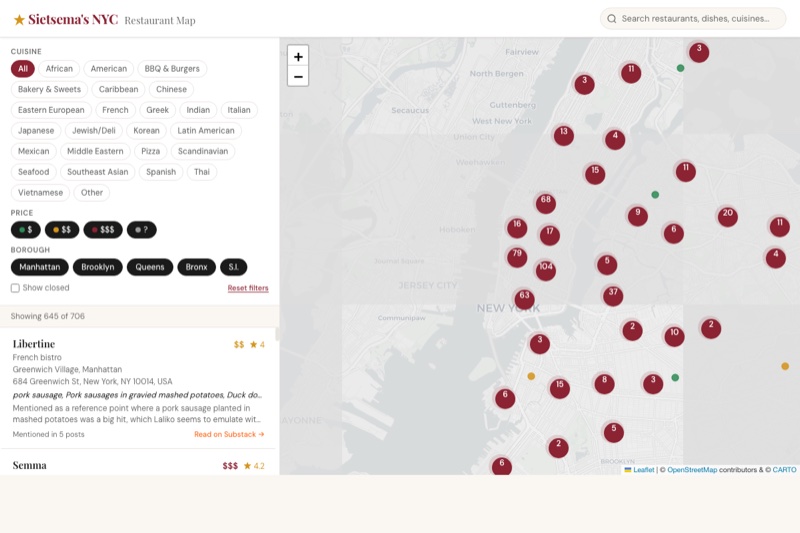
NYC Restaurant Map
Interactive map of 706 NYC restaurants extracted from food critic Robert Sietsema's Substack using LLM-based analysis, enriched with Google Places data.
Python Leaflet.js Claude Code Google Places API
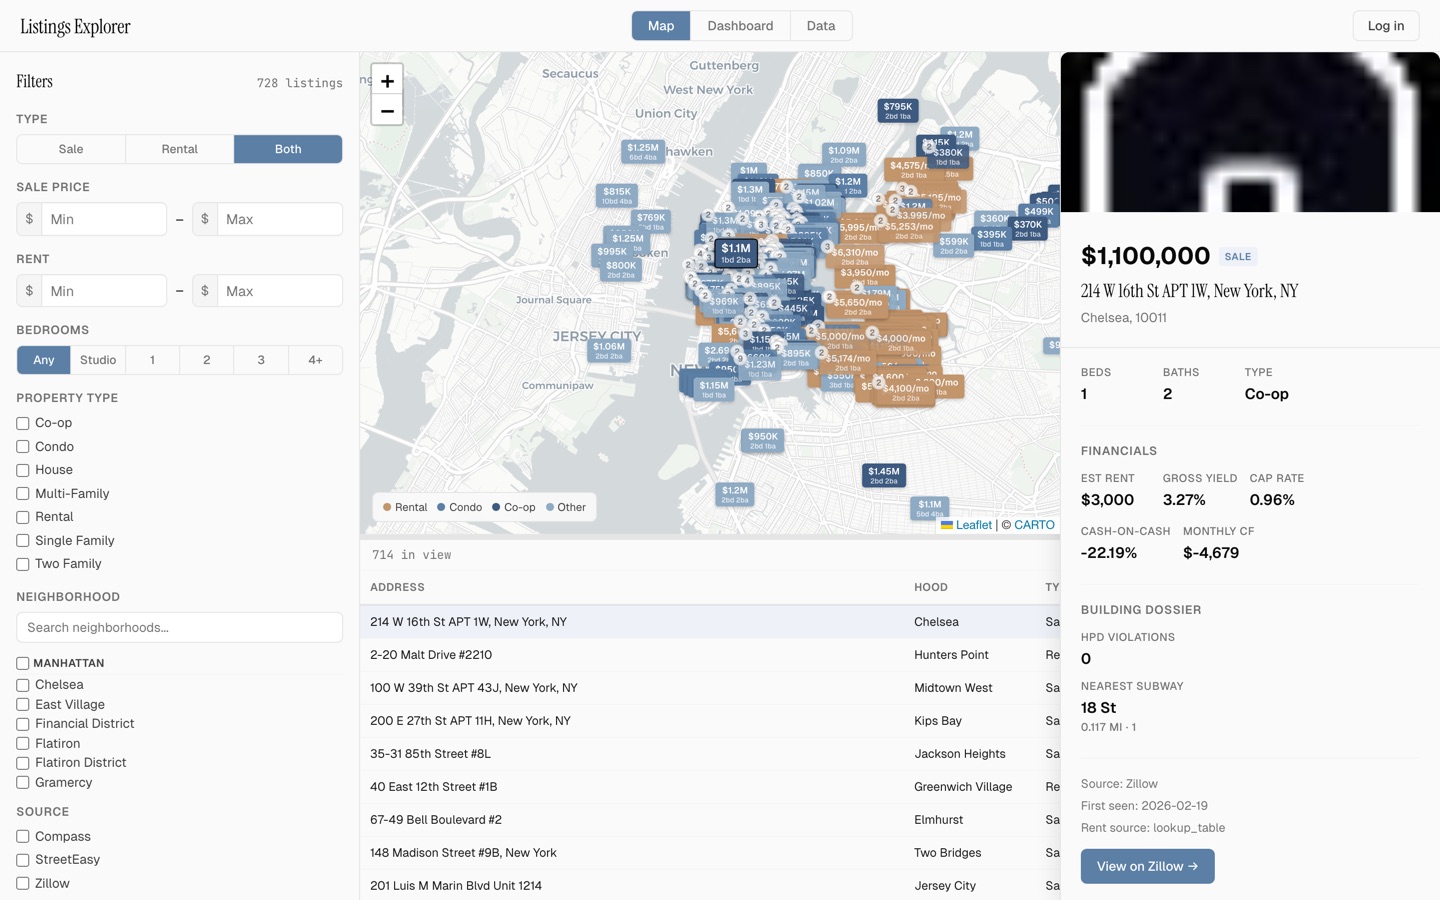
Listings Explorer
Interactive map of NYC real estate listings with filtering, financial metrics, and personal saves.
React Leaflet.js Supabase
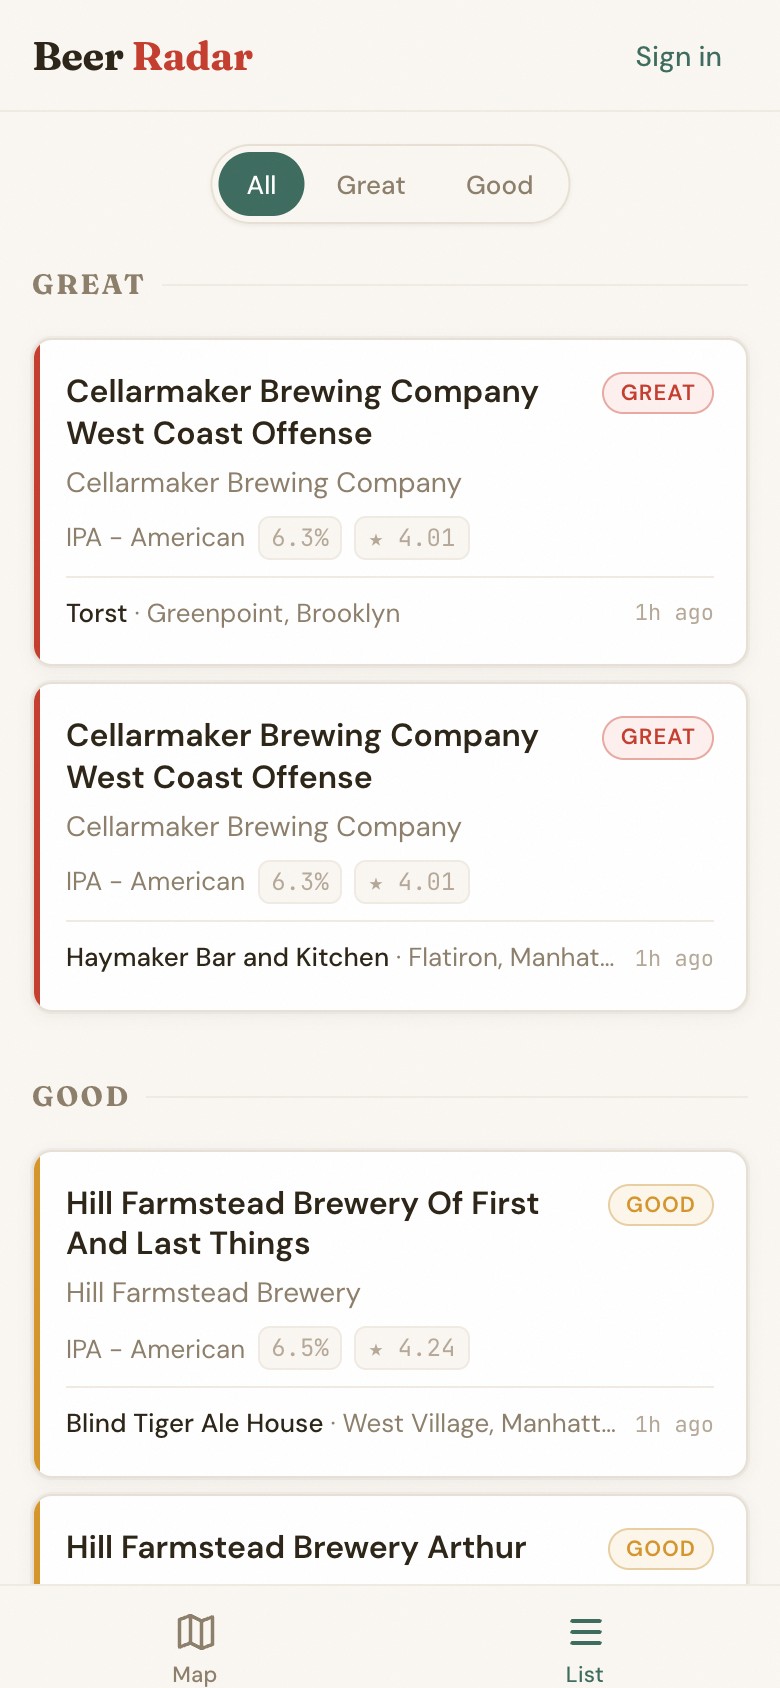
Beer Radar
Rare beer hunter for NYC — tracks West Coast IPAs and Belgian lambics at curated bars via Untappd checkin signals.
React Leaflet.js Supabase Python
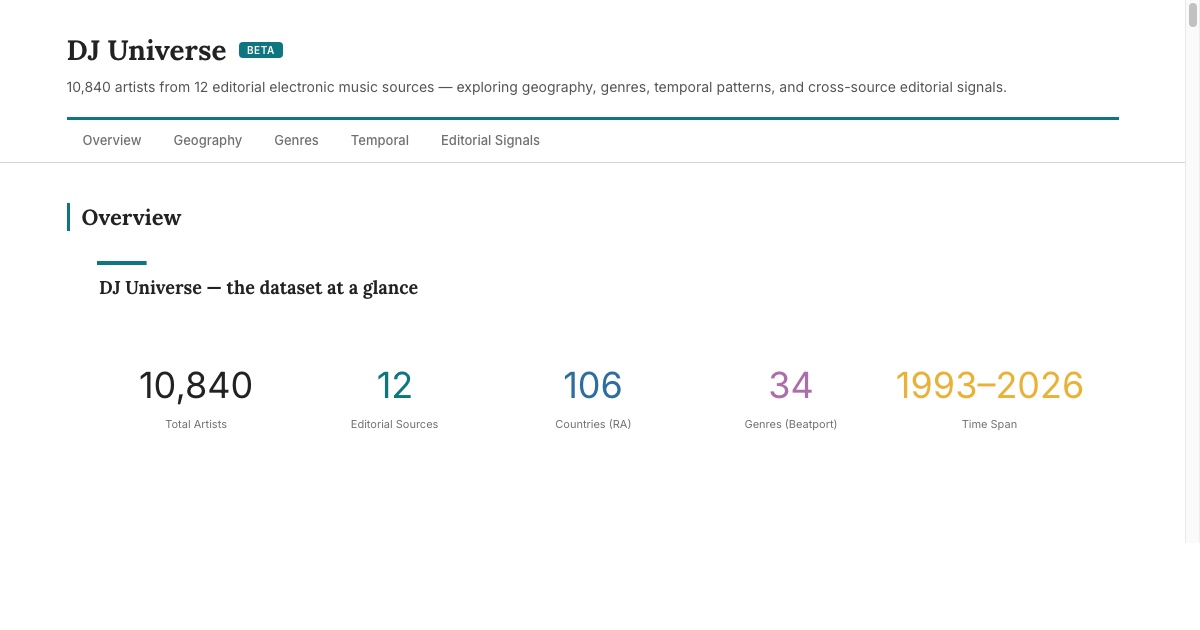
DJ Universe BETA
Exploratory dashboard of 10,840 electronic music artists from 12 editorial sources — geography, genres, temporal patterns, and cross-source signals.
Python Plotly Beatport Resident Advisor
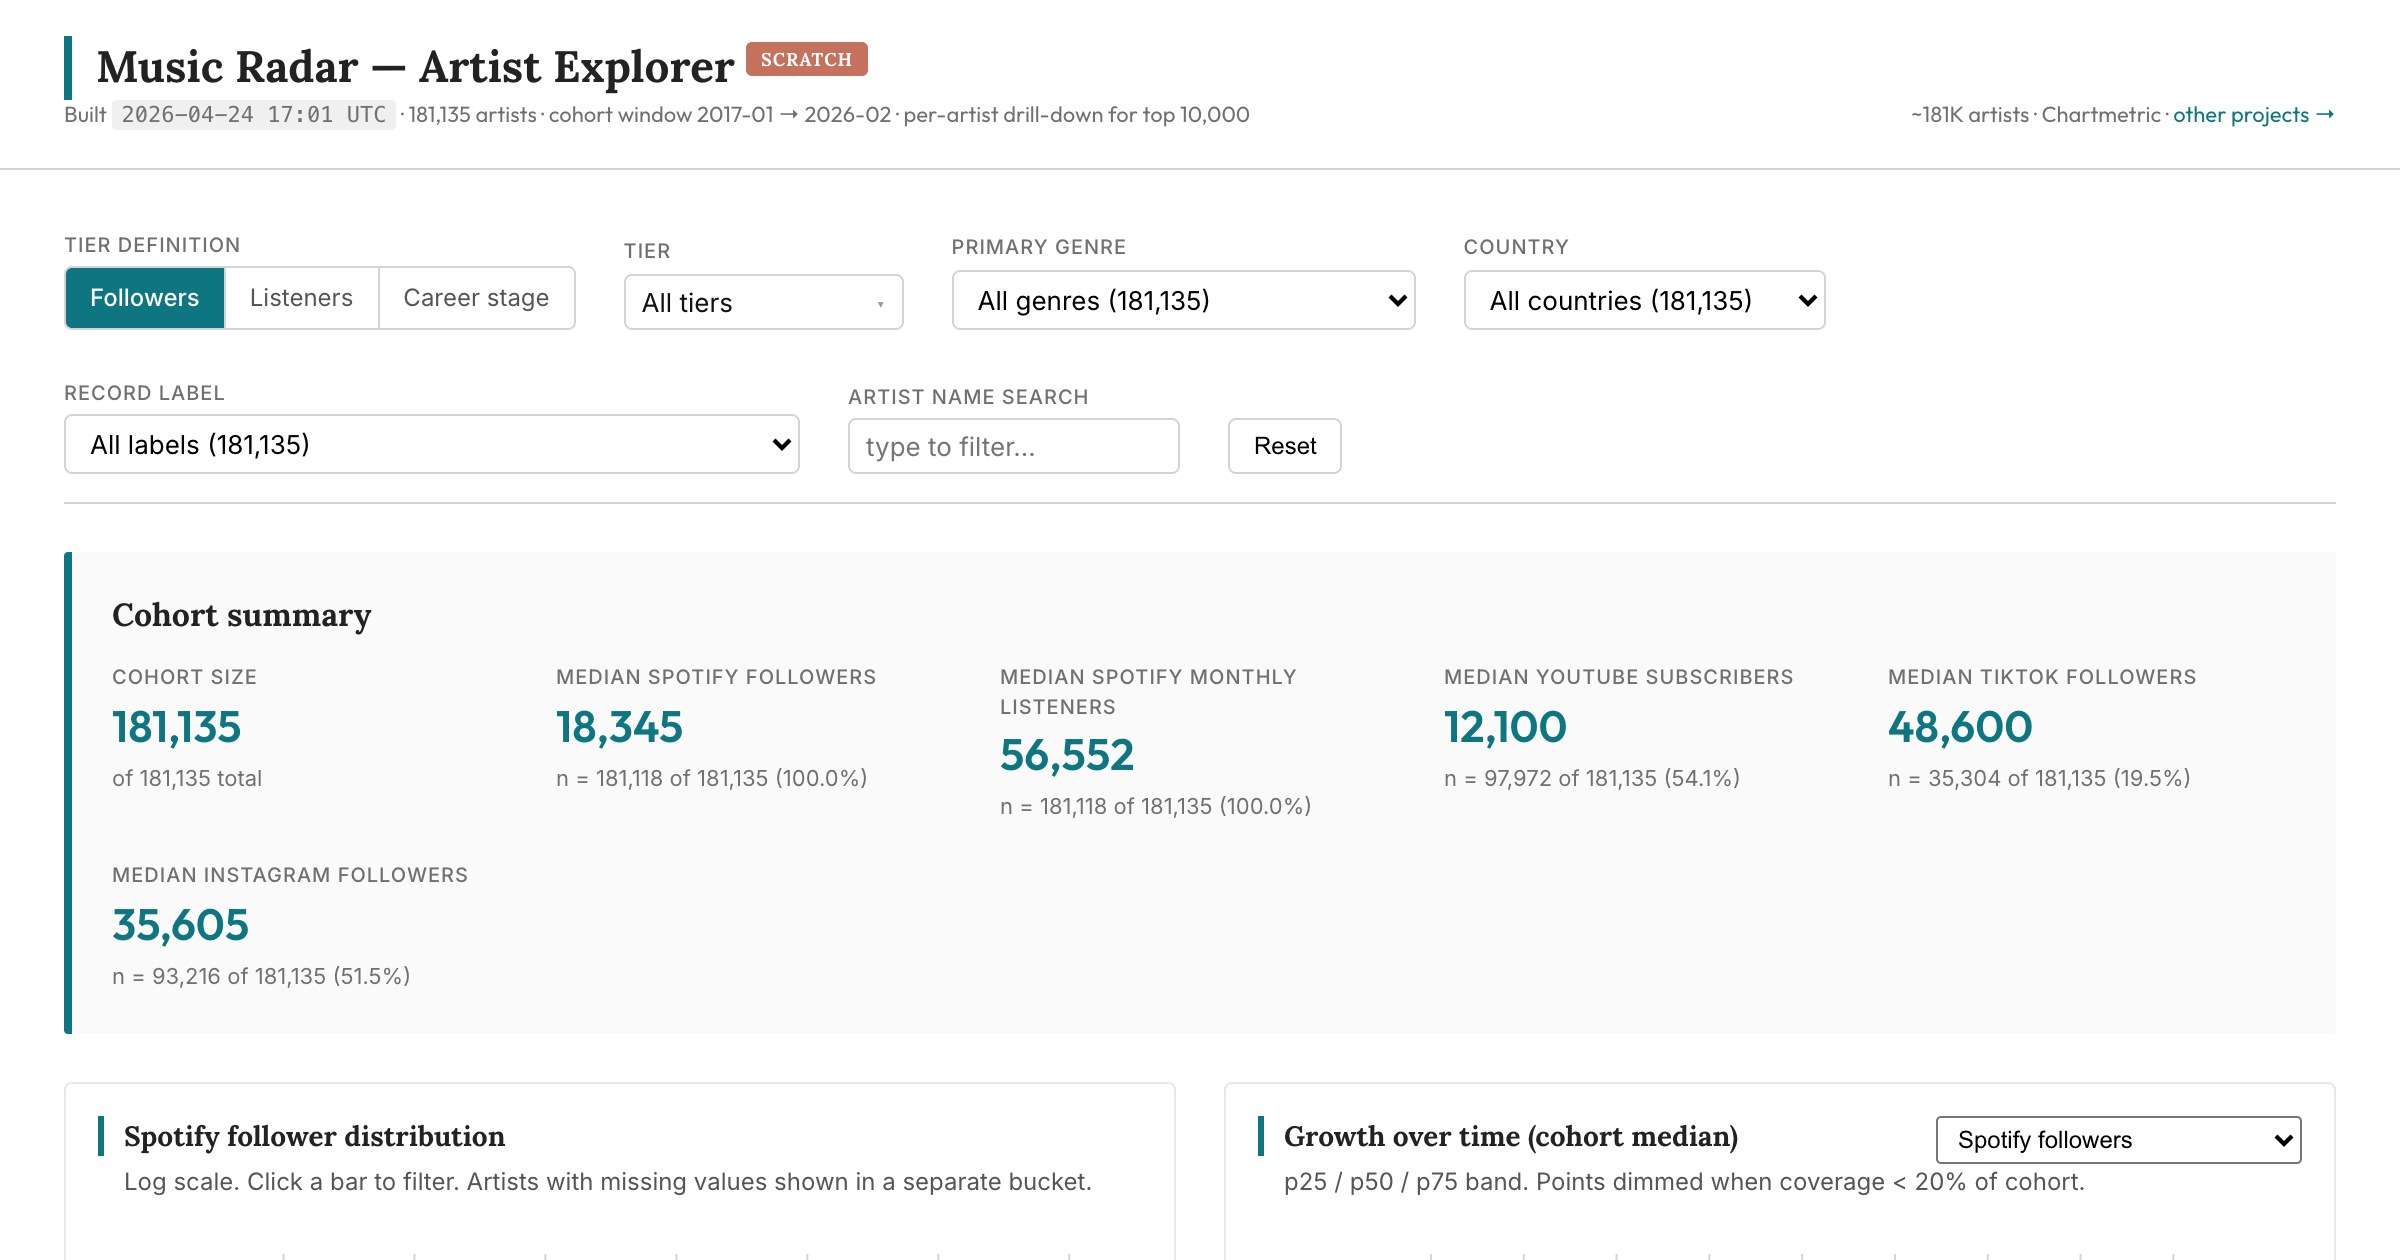
Music Radar — Artist Explorer SCRATCH
Interactive sandbox over ~181K Chartmetric-tracked artists. Filter by tier, genre, country, and label; cross-filter via charts; drill into per-artist 9-year time-series across Spotify, YouTube, TikTok, and Wikipedia.
Python Plotly DuckDB Chartmetric API
Music Radar — Industry Atlas DRAFT
Mary Meeker-style strategy atlas of the music industry — artist supply, customer demand, discovery signals, platform divergence, and durable economics.
Python Plotly DuckDB Chartmetric API
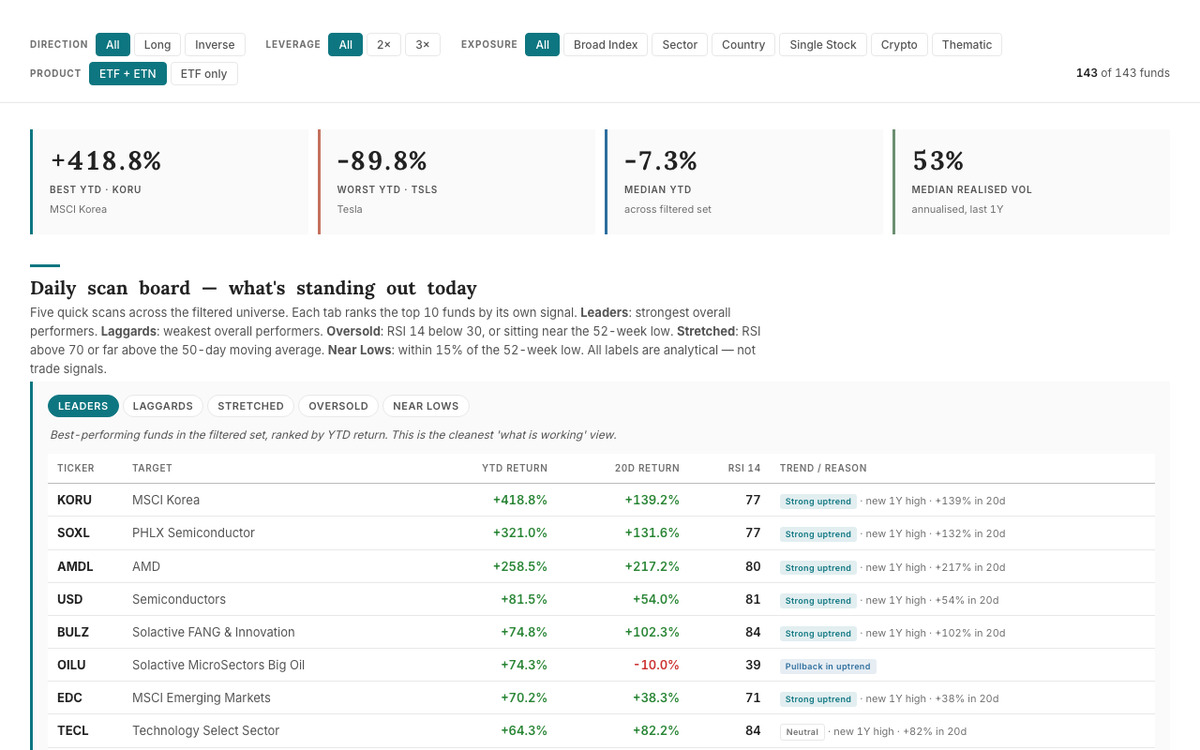
Leveraged ETF Radar BETA
Scanner for U.S.-listed leveraged ETFs and ETNs: leaders, laggards, stretched names, oversold funds, drawdowns, and technical signals.
Python Plotly Yahoo Finance LLM Analysis
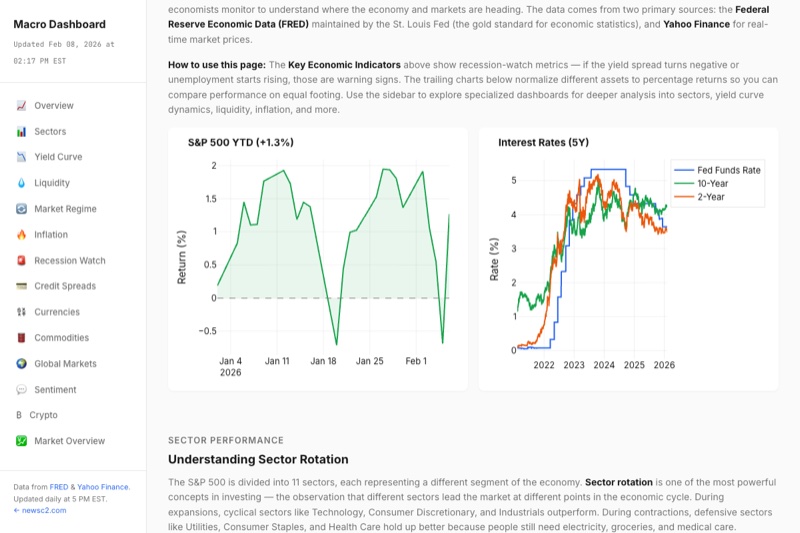
Macro Dashboard
30+ economic and market indicators from FRED and Yahoo Finance, with daily LLM-generated market summaries and interactive Plotly charts.
Python Plotly FRED API